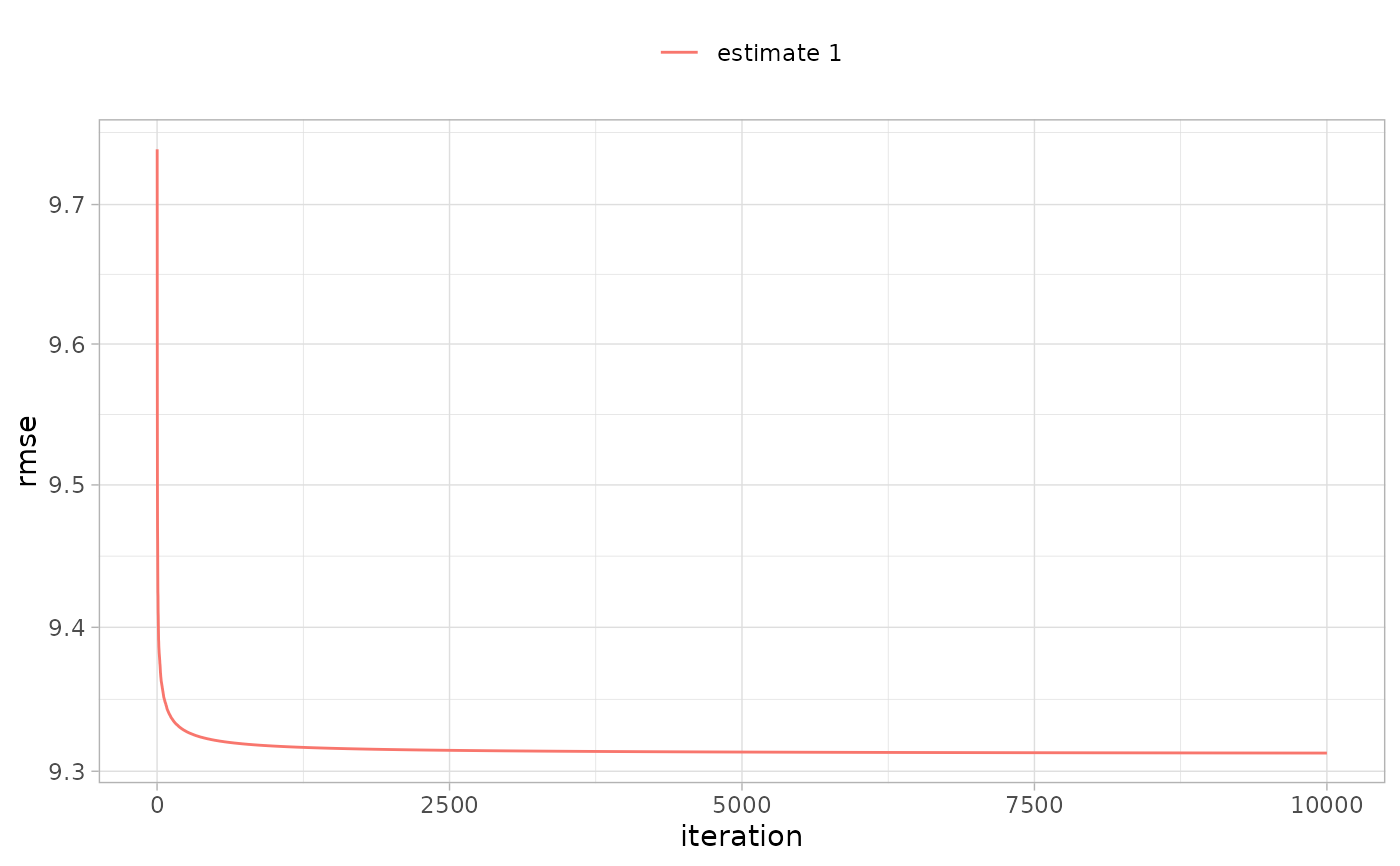
A diagnostic plot for sc.weight.fw.covariates. Plots the objective function, regularized RMSE, as a function of the number of Frank-Wolfe / Gradient steps taken. Requires ggplot2
Source:R/plot.R
synthdid_rmse_plot.RdA diagnostic plot for sc.weight.fw.covariates. Plots the objective function, regularized RMSE, as a function of the number of Frank-Wolfe / Gradient steps taken. Requires ggplot2
Examples
# \donttest{
data(california_prop99)
setup <- panel.matrices(california_prop99)
tau.hat <- synthdid_estimate(setup$Y, setup$N0, setup$T0)
synthdid_rmse_plot(tau.hat)

# }
# }