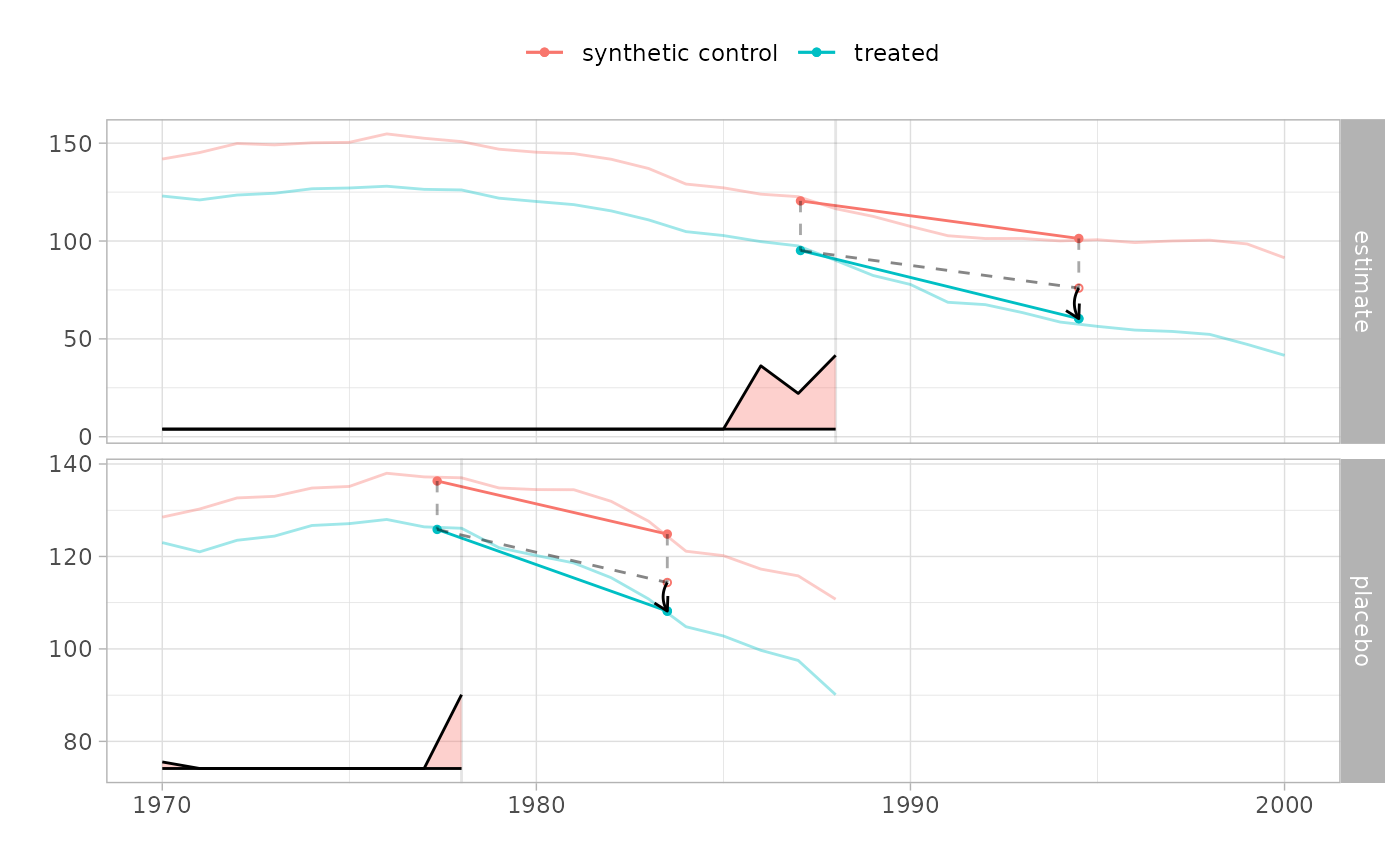
For our estimator and a placebo, plots treated and synthetic control trajectories and overlays a 2x2 diff-in-diff diagram. Requires ggplot2
Source:R/plot.R
synthdid_placebo_plot.RdFor our estimator and a placebo, plots treated and synthetic control trajectories and overlays a 2x2 diff-in-diff diagram. Requires ggplot2
Examples
# \donttest{
data(california_prop99)
setup <- panel.matrices(california_prop99)
tau.hat <- synthdid_estimate(setup$Y, setup$N0, setup$T0)
synthdid_placebo_plot(tau.hat, treated.fraction = 0.5)

# }
# }