Outputs the effect curve that was averaged to produce our estimate
Source:R/synthdid.R
synthdid_effect_curve.RdOutputs the effect curve that was averaged to produce our estimate
Examples
# \donttest{
data(california_prop99)
setup <- panel.matrices(california_prop99)
tau.hat <- synthdid_estimate(setup$Y, setup$N0, setup$T0)
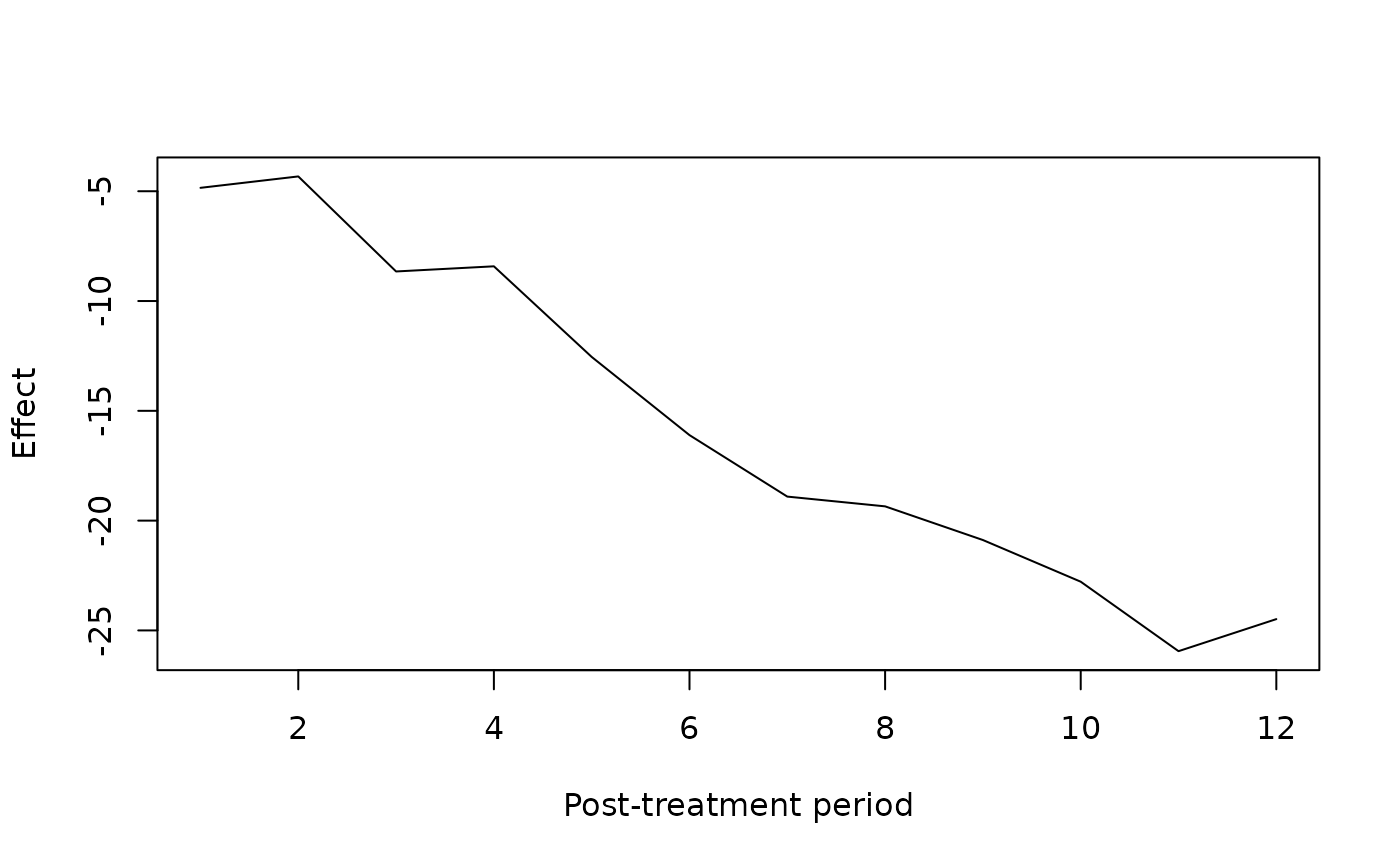
# Get effect curve over time
effect_curve <- synthdid_effect_curve(tau.hat)
plot(effect_curve, type = "l", xlab = "Post-treatment period", ylab = "Effect")
 # }
# }